Provide a PDB ID or upload a structure file (pdb or mmCIF format) and our server will calculate the 200 lowest-frequency normal modes of the protein structure, followed by the analyses selected with the checkboxes.
The overlap analysis compares the structural difference between two conformations of the same protein to the displacements described by the calculated normal modes of the submitted structure. The structure provided for the overlap analysis must have the same number of CA-atoms as the one the normal modes were calculated for, and the atoms of the two structures should correspond to each other in the order they appear in the PDB-files.
If no alignment at the FASTA format is submitted the default alignment for comparative analyses is performed by MUSTANG. In addition to a FASTA formatted alignment file, you will be able to access the following information:
If you use your own alignment file, the alignment file needs to be written in the FASTA format and meet the following requirements:
>1FUJ.pdb|A
ivggheaqphsrpymaslqm---rgnpgshfcggtlihpsfvltaahclr
dipqrlvn---vvlgahnvrtqeptqqhfsvaqvfln-nydaenklndil
liqlsspanlsasvatvqlpqqdqpvphgtqclamgwgrvgahdppaqvl
qelnvtvvt---------ffcrphnict-fvprrk-a-gicfgdsggpli
cdgiiqgidsfviwgcatrlfpdfftrvalyvdwirstlr
>1PPF.pdb|PDBID|CHAIN|E
ivggrrarphawpfmvslql---rg---ghfcgatliapnfvmsaahcva
nvn---vravrvvlgahnlsrreptrqvfavqrifen-gydpvnllndiv
ilqlngsatinanvqvaqlpaqgrrlgngvqclamgwgllgrnrgiasvl
qelnvtvvt---------slcrrsnvct-lvrg-r-qagvcfgdsgsplv
cnglihgiasfvrggcasglypdafapvaqfvnwidsiiq
The size limitation of the submission is 10000 amino acids per structure, for up to 20 structures.
We show the example of analysis done on the bacterial pentameric proton-gated ion channel (GLIC).
In the overlap analysis, we used the structure in one of the locally-closed states (PDB ID: 3tlu) and open state (PDB ID: 3eam). We first input 3tlu in the PDB ID field of the Single PDB Analyses form, where WEBnm@ will proceed to calculate its normal modes, and then input 3eam in the PDB ID field of Overlap analysis. After the submitted job was finished successfully, we were able to click the link to the analysis result webpage.
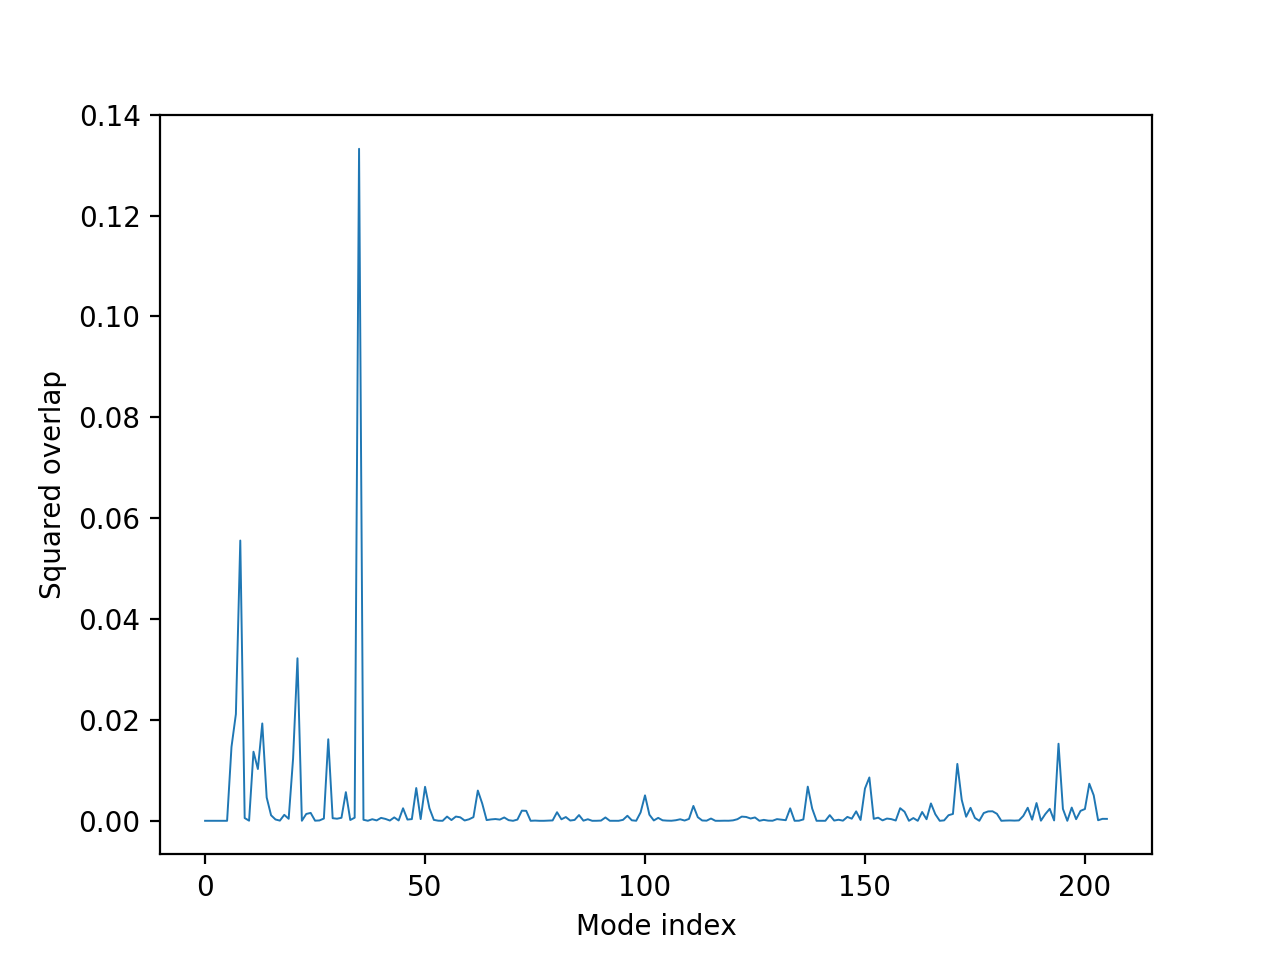
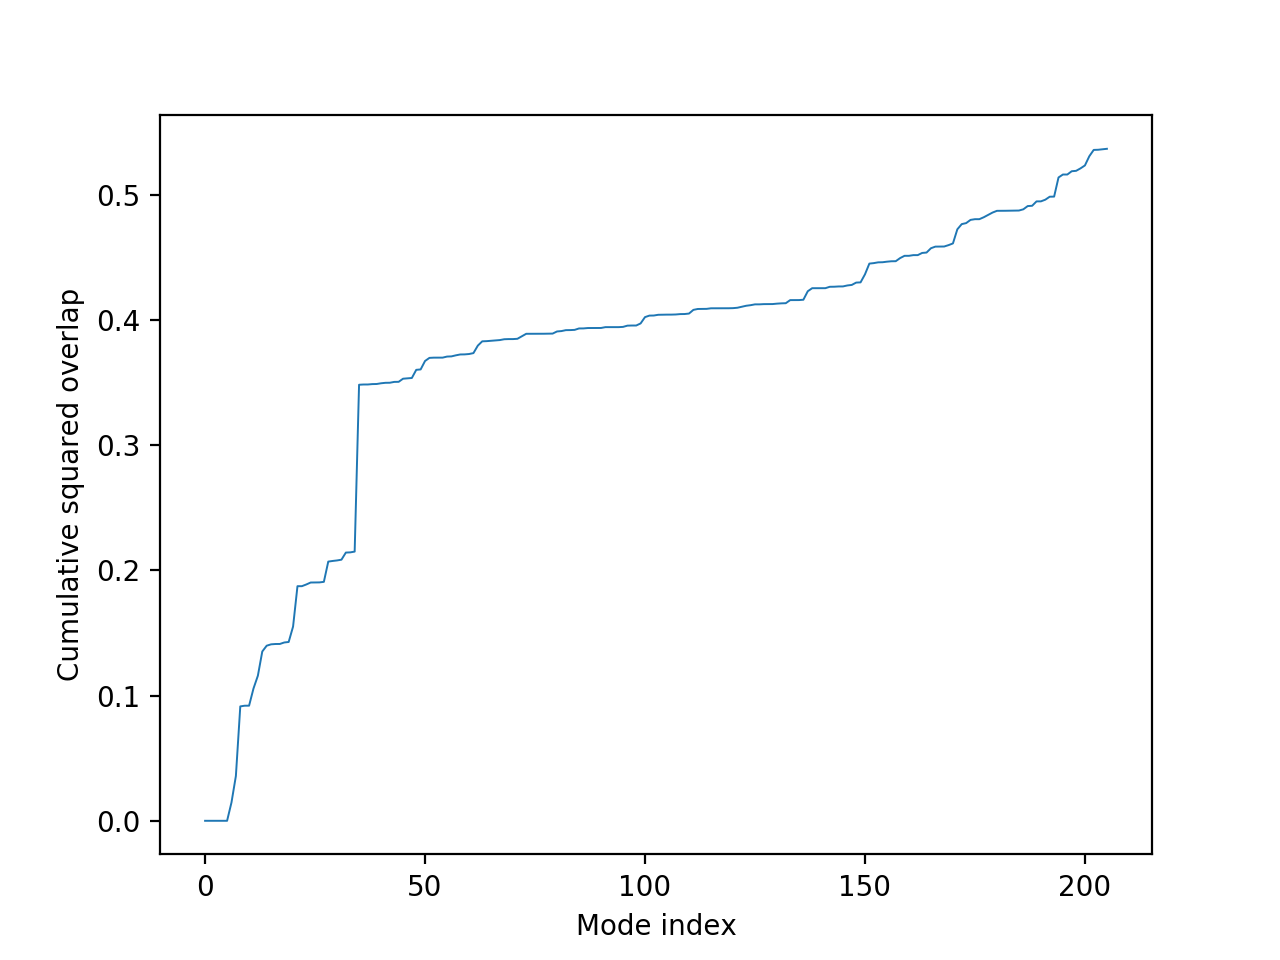
The transition from one state to the other is characterized by the following two plots, where the x-axis represents the mode number, and the y-axis represents the dot product of the vectors from the mode and the coordinates of the second structure, and in the case of the cumulative plot, this score sums to one.

In the overlap plot (above), the peaks represent the modes that contribute significantly to this conformational change, the highest of which is the 36th mode. (Note that the first 6 modes represent rigid-body rotational/translational movements, hence 0 score.) The mode index for the given scores are also given in a raw data file. The cumulative overlap (below) shows the number of modes that give the most coverage.

(Input files used: Fasta file Structure 1 Structure 2 Structure 3 Structure 4 )
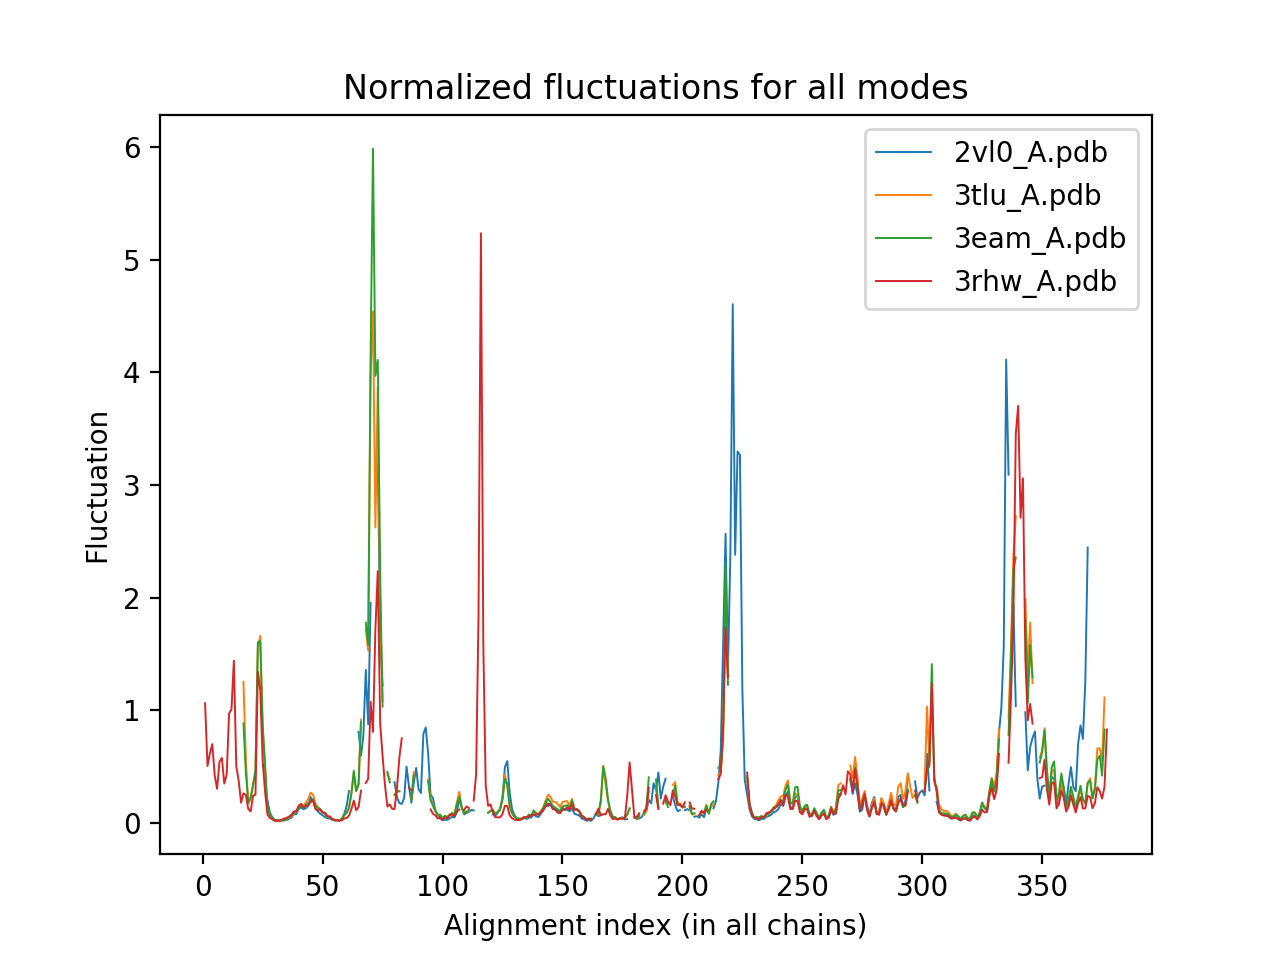
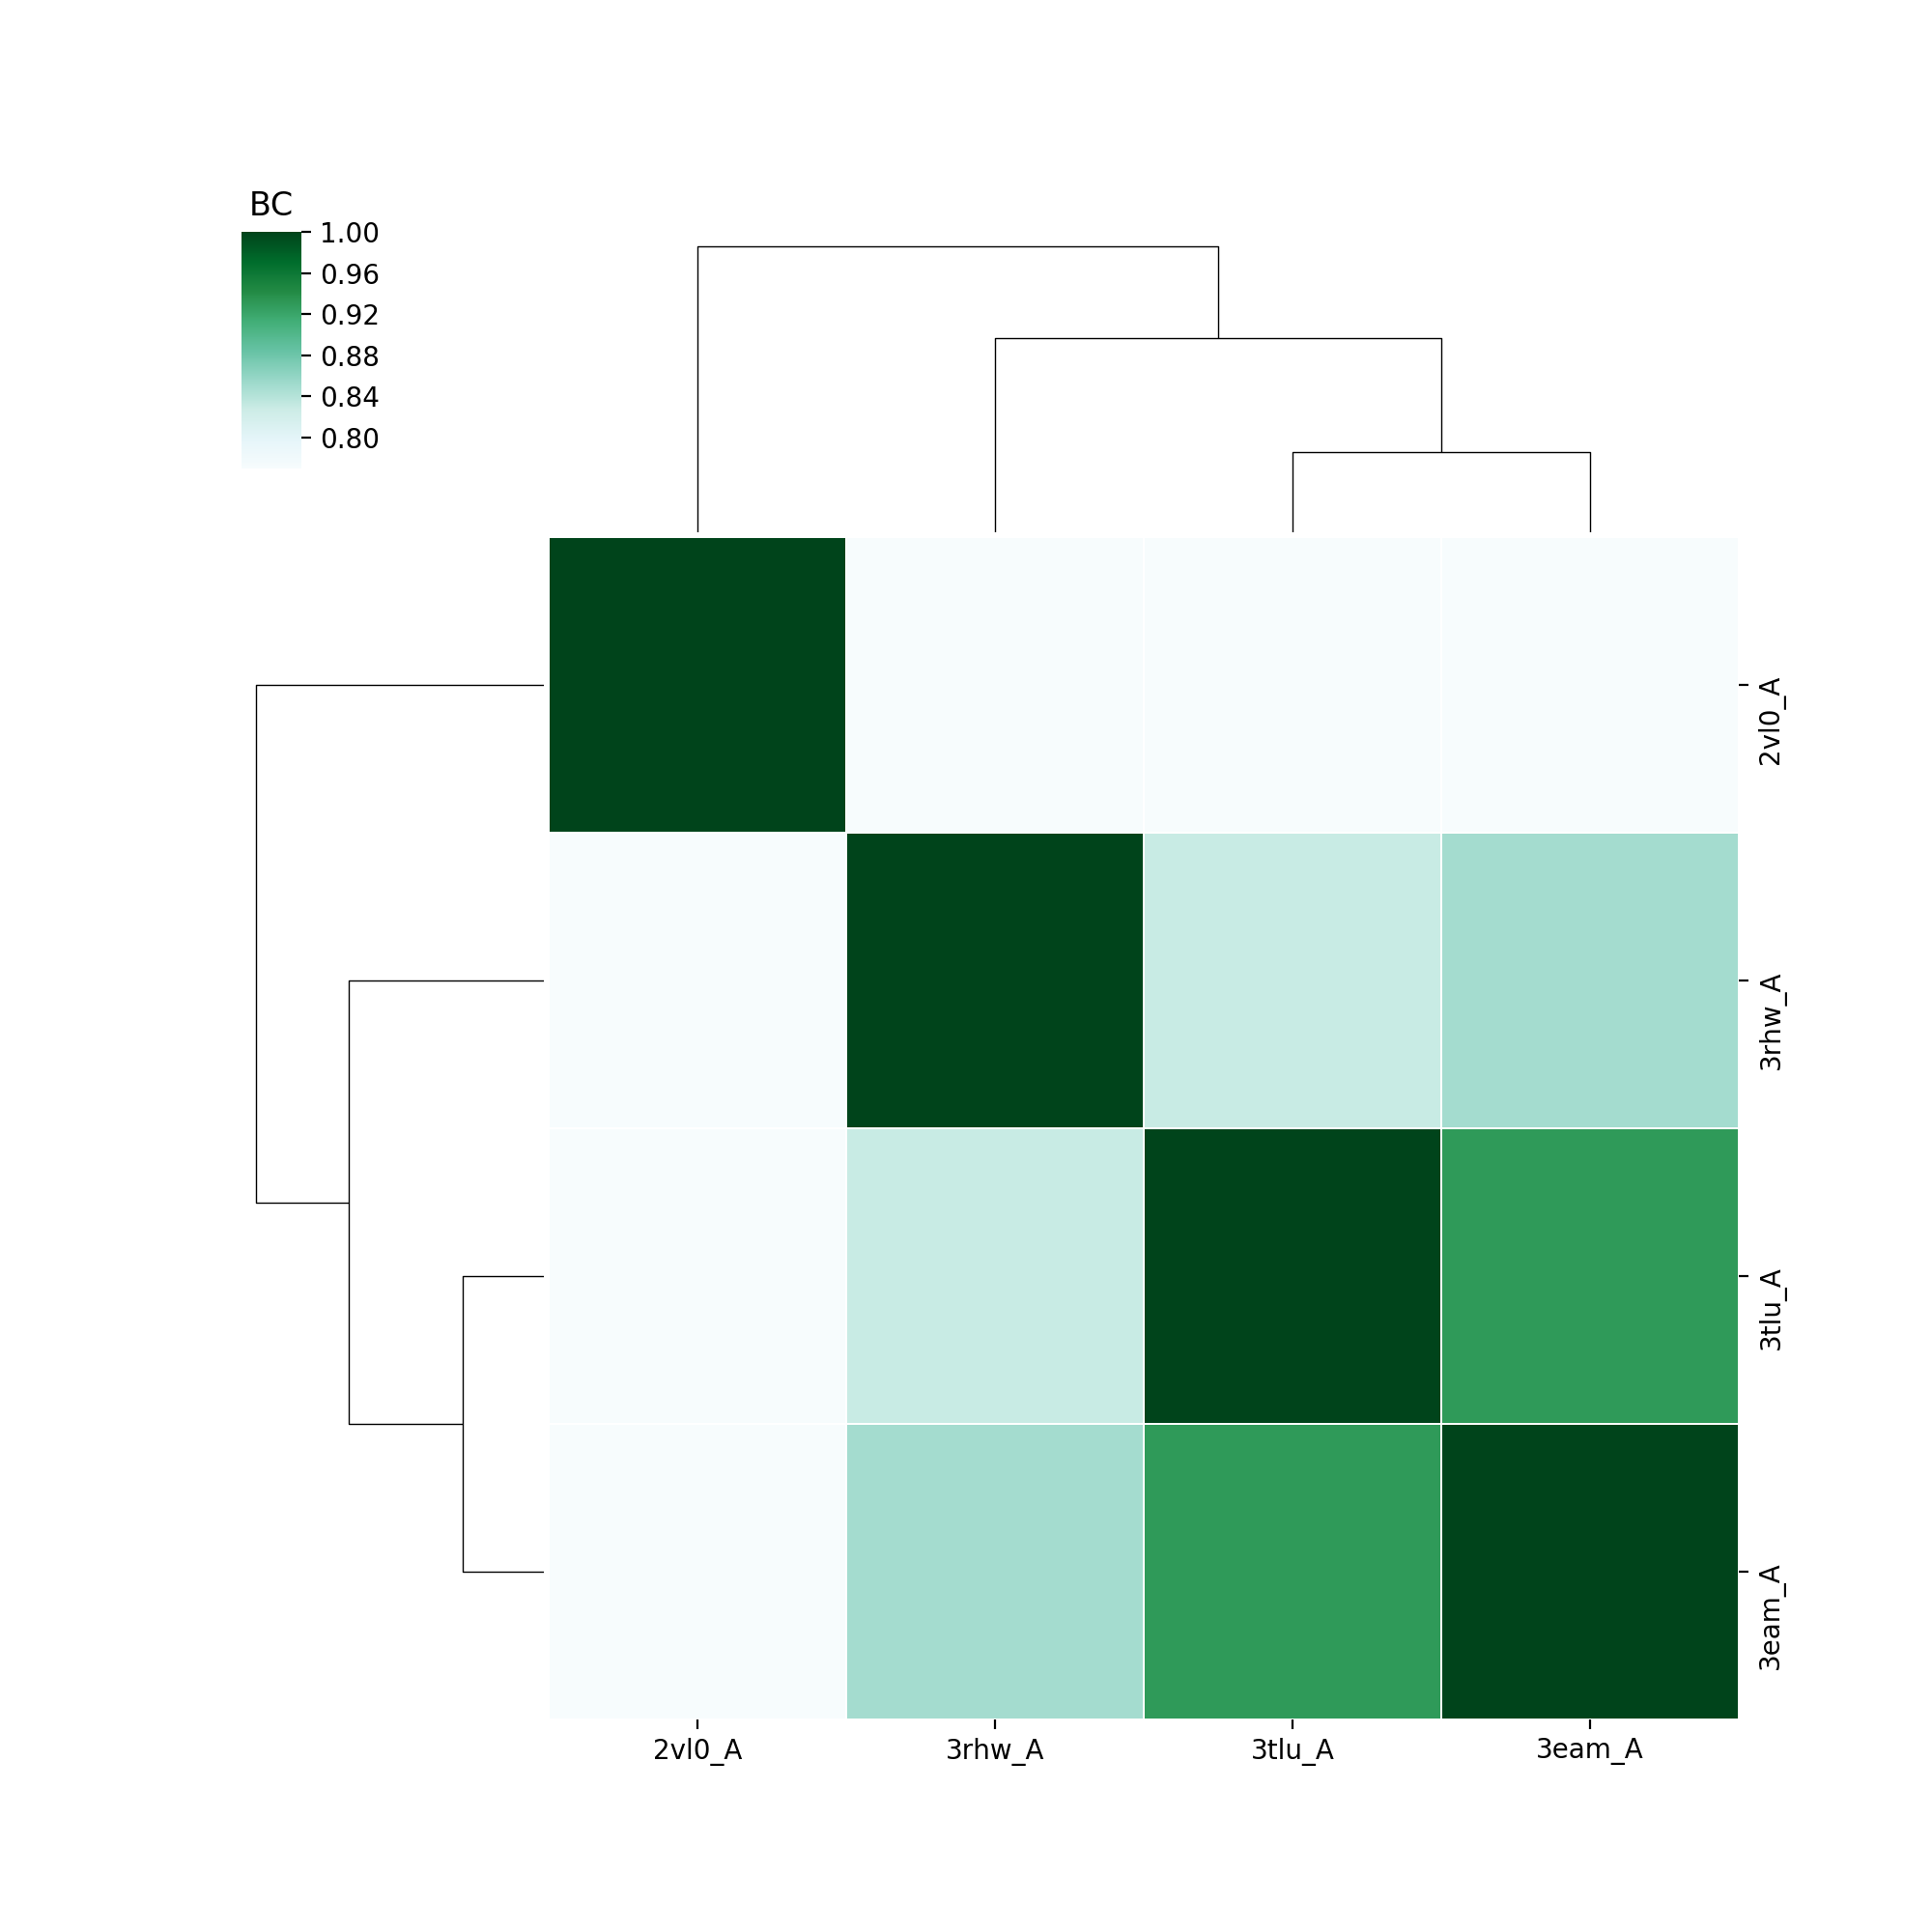
The single subunits of 3eam, 3tlu were aligned with homologues ELIC (2vl0) and GluCl (3rhw). The following two output plots show respectively the normalized fluctuations profile and the comparative overlap heatmap which uses the Bhattacharya Coefficient (BC) scoring.

In the normalized fluctuations profile, the x-axis is the alignment index according to sequence in the proteins while the y-axis represents the score, which is summed, averaged and weighted by each mode's contribution for each position.

The comparative overlap heatmap is represented such that each structure pairs with each other, including itself. This gives a diagonal which gives the maximum score of 1.0, while the others are lower, ranging between 0.7 and 0.8. This shows that despite these structures having sequence identities of between 22-32%, their dynamics are much more similar.