Calculate and analyse the lowest-frequency normal modes of one protein structure

Input your PDB ID
or a structure file
WEBnm@ computes the normal modes
or YOU upload the normal mode file
WEBnm@ performs the calculations
on the server
WEBnm@ shows you the results
on the webpages
Compute the eigenvalues and deformation energies for low-frequency modes
Display the displacement of each Cα atom and the atomic fluctuations of the protein
Display the correlations between the motions of all the Cα atoms in the protein structure
Compare the normal modes of your structure with the transition to a different conformation of the same protein
Upload multiple protein structure files
WEBnm@ computes the alignment and normal modes
for all the structures
WEBnm@ performs the analyses
on the server
WEBnm@ shows you the results
on the webpages
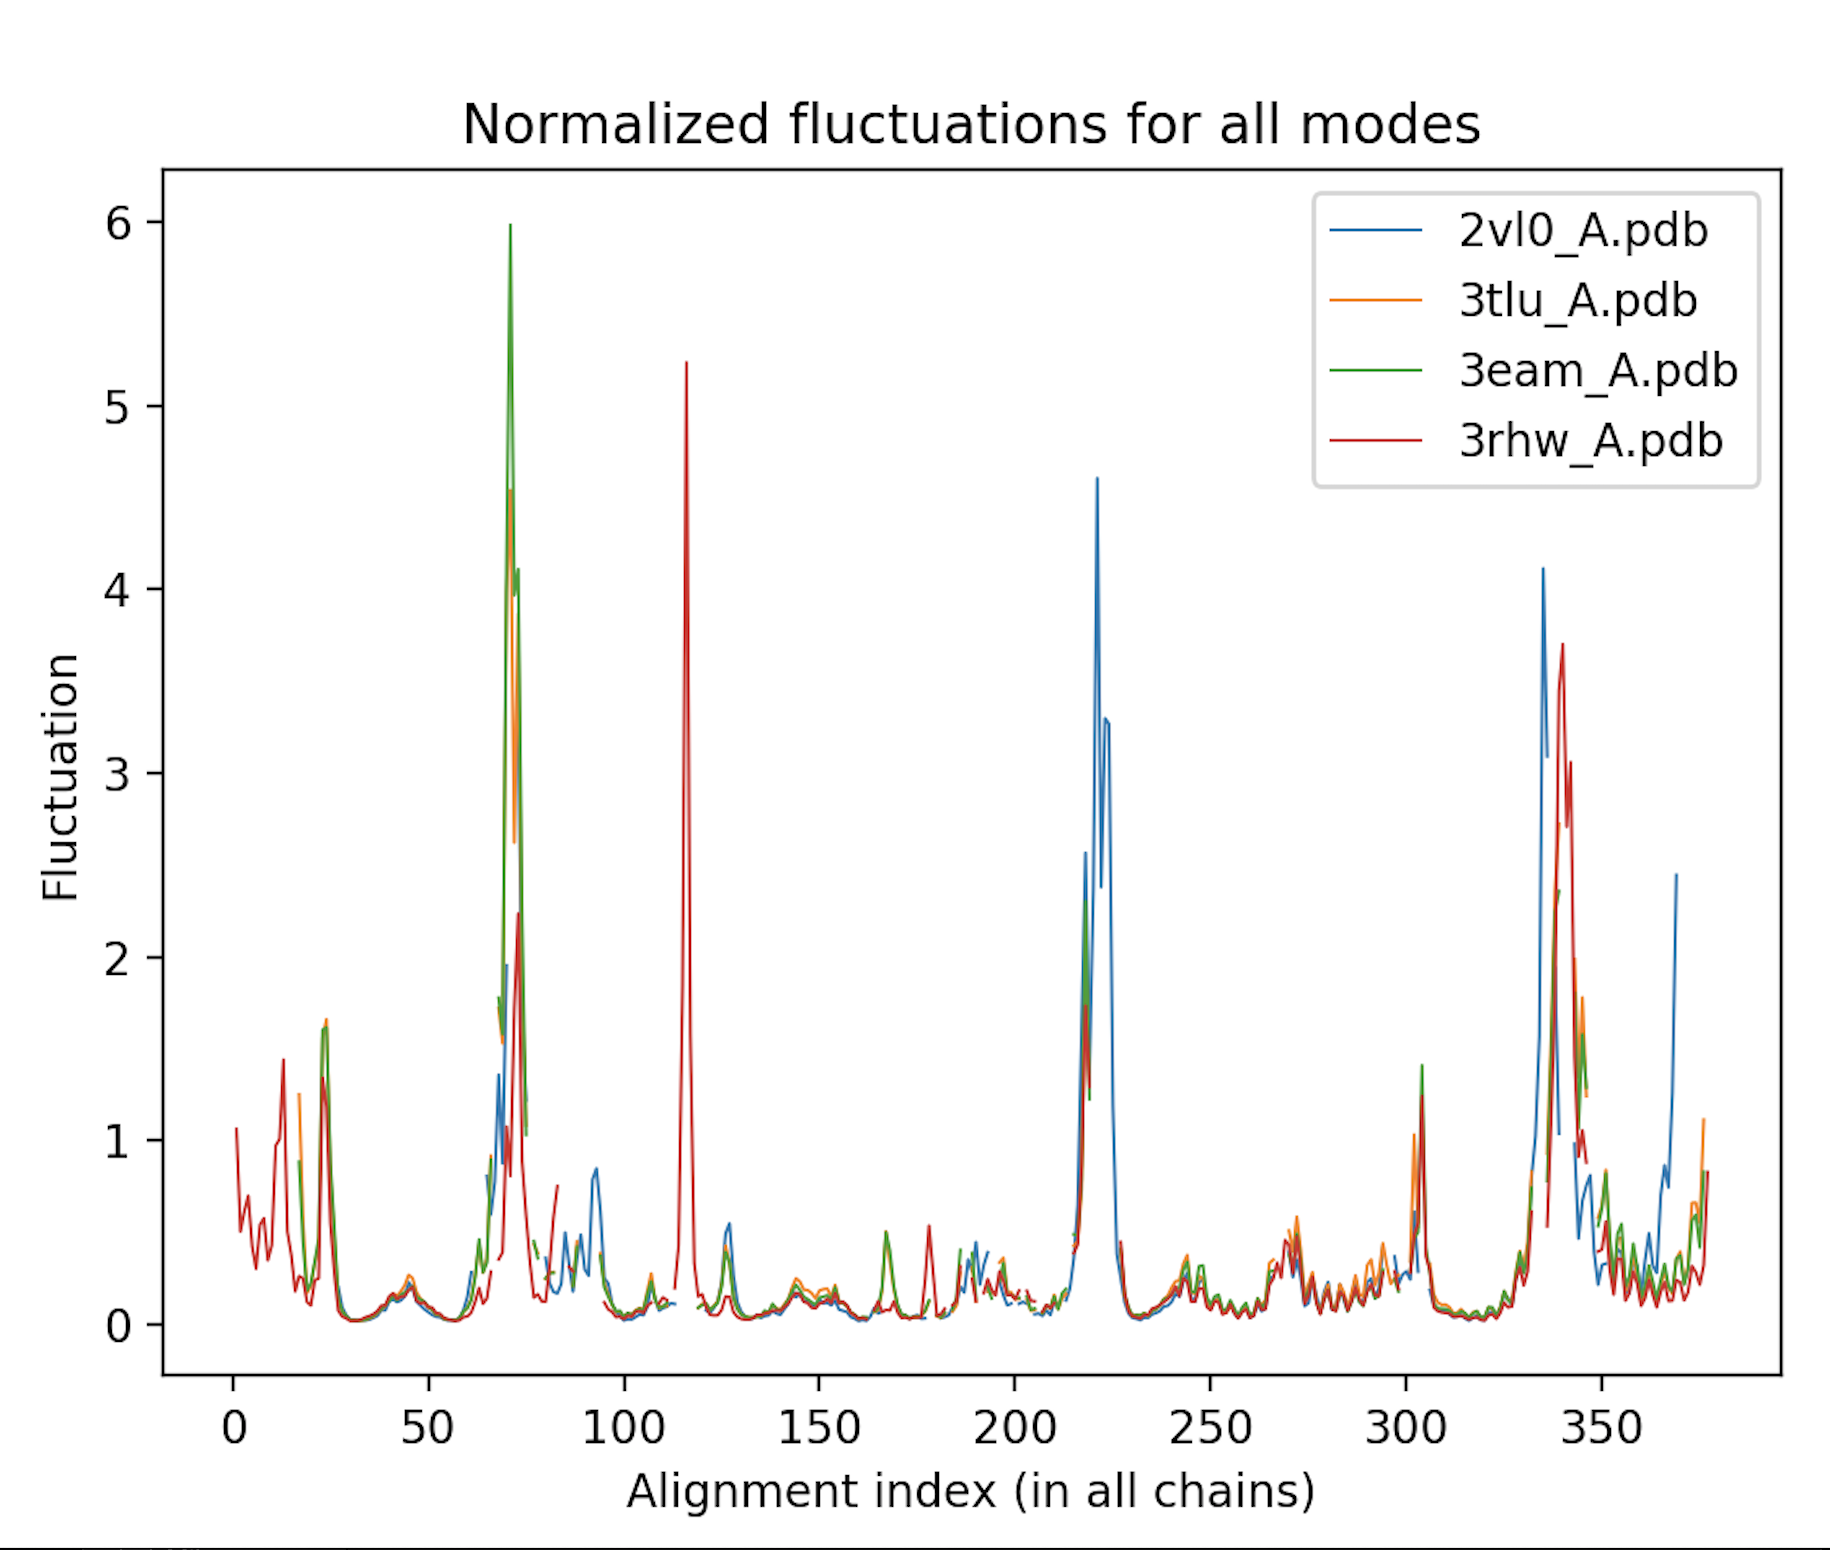
Calculate and compare the normal modes of a set of aligned protein structures
Calculate the atomic deformation energies and fluctuations of each protein, and plot them according to the alignment to enable comparison between these proteins
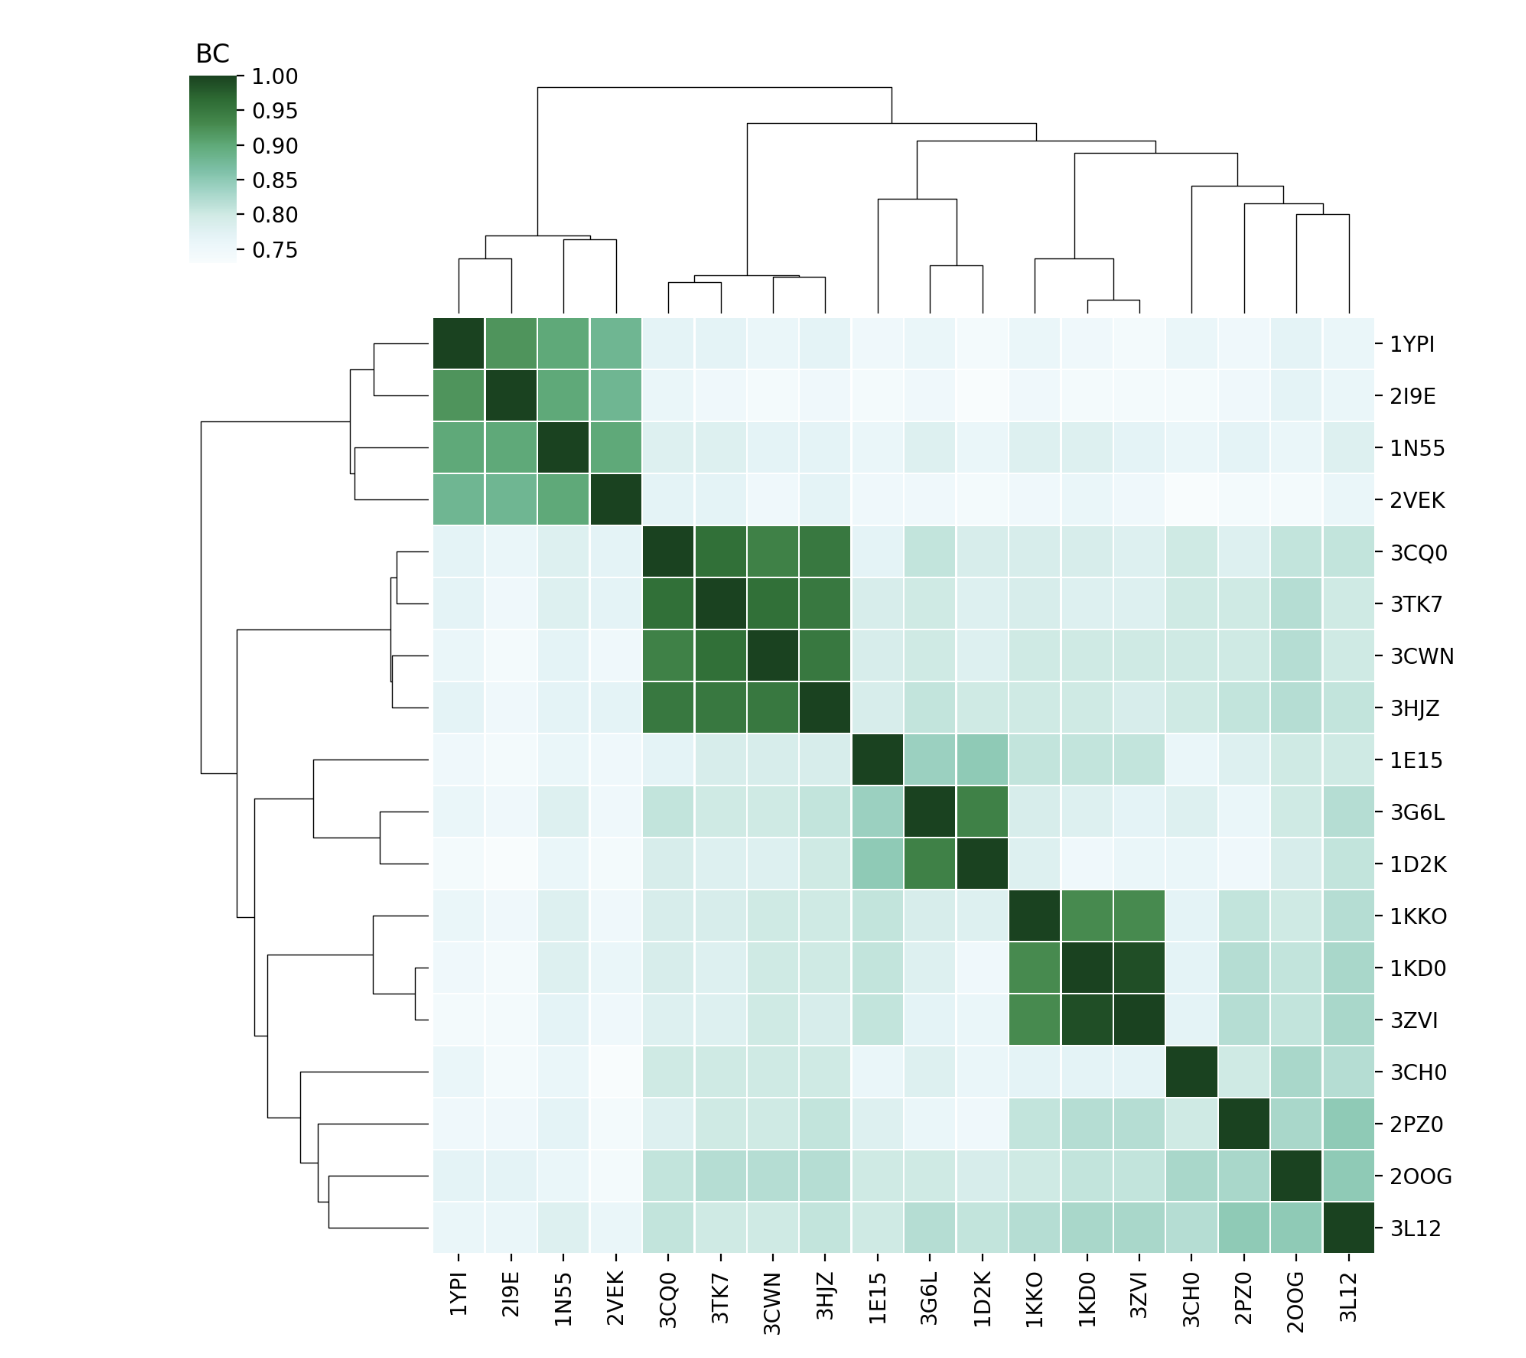
Compare the sets of modes of each protein using BC (Bhattacharyya coefficient) of their covariance matrices and RMSIP (Root Mean Square Inner Product) of the lowest energy modes
If you use WEBnm@ in your research, please do cite the following publication:
Tiwari SP, Fuglebakk E, Hollup SM, Skjærven L, Cragnolini T, Grindhaug SH, Tekle KM, Reuter N. WEBnm@ v2.0: Web server and services for comparing protein flexibility. BMC Bioinformatics. 2014; 15:427WEBnm@ v. 1.0 was first reported in the following publication:
Hollup SM, Sælensminde G, Reuter N. WEBnm@: a web application for normal mode analysis of proteins BMC Bioinformatics. 2005 Mar 11; 6:52